Last Updated on 5 months by Francis
Electromagnetic waves are categorized based on their frequency and wavelength. Visible light falls within the wavelength range of approximately 400 nm to 700 nm. Ultraviolet light has a higher frequency and shorter wavelength than visible light, while infrared light has a lower frequency and longer wavelength. These different types of electromagnetic radiation are part of the larger electromagnetic spectrum, each with its own characteristic range of frequencies and wavelengths.
Contents
Key Takeaways:
- Infrared, visible light, and ultraviolet rays are part of the electromagnetic spectrum.
- Visible light has a wavelength range of approximately 400 nm to 700 nm.
- Ultraviolet light has a higher frequency and shorter wavelength than visible light.
- Infrared light has a lower frequency and longer wavelength than visible light.
- Understanding the relationship between these types of electromagnetic radiation is essential in various fields.
Understanding the Electromagnetic Spectrum

Electromagnetic waves encompass a vast range of frequencies and wavelengths, forming what is known as the electromagnetic spectrum. This spectrum includes different types of waves, such as ultraviolet light, infrared light, and visible light. Each type of wave has its own distinct characteristics within the spectrum.
Visible light, which is the range of wavelengths that our eyes can perceive, falls within a specific band of the electromagnetic spectrum. It spans from approximately 400 nm to 700 nm in wavelength. Ultraviolet light, on the other hand, has a higher frequency and shorter wavelength than visible light. It falls in the range between X-rays and visible light. In contrast, infrared light has a lower frequency and longer wavelength than visible light.
The electromagnetic spectrum is not limited to just visible light, ultraviolet light, and infrared light. It also includes other types of waves, such as X-rays, gamma rays, microwaves, and radio waves. Each of these waves has its own unique range of frequencies and wavelengths. This wide spectrum of electromagnetic waves plays a crucial role in various fields, from medical imaging and communication technology to environmental monitoring and scientific research.
Table 1: Comparison of Electromagnetic Waves
| Type of Wave | Frequency Range | Wavelength Range |
|---|---|---|
| Radio Waves | 30 Hz – 300 GHz | 1 mm – 100,000 km |
| Microwaves | 300 MHz – 300 GHz | 1 mm – 1 m |
| Infrared Waves | 300 GHz – 400 THz | 700 nm – 1 mm |
| Visible Light | 400 THz – 790 THz | 400 nm – 700 nm |
| Ultraviolet Waves | 790 THz – 30 PHz | 10 nm – 400 nm |
| X-rays | 30 PHz – 30 EHz | 10 pm – 10 nm |
| Gamma Rays | 30 EHz and above | Less than 10 pm |
The electromagnetic spectrum is a fundamental concept in understanding the nature of light and its interactions with matter. It allows scientists and researchers to study the properties of different waves, their behavior, and their applications in various fields. By exploring the electromagnetic spectrum, we gain valuable insights into the fundamental workings of the universe.
Exploring the Relationship between Frequency and Wavelength

Frequency and wavelength are two fundamental properties that describe the behavior of electromagnetic waves. Understanding the relationship between these two factors is essential in comprehending the characteristics of different types of electromagnetic radiation, including infrared, visible light, and ultraviolet rays.
The frequency of an electromagnetic wave refers to the number of complete oscillations it makes per unit of time. It is measured in hertz (Hz), where 1 Hz equals one oscillation per second. On the other hand, wavelength represents the spatial distance between two consecutive points in the wave that are in phase with each other. It is typically measured in meters (m), nanometers (nm), or other units of length.
In general, frequency and wavelength are inversely proportional to each other. This means that as the frequency of an electromagnetic wave increases, its wavelength decreases, and vice versa. Mathematically, this relationship can be expressed as:
Speed of light = Frequency x Wavelength
This equation demonstrates that the speed of light remains constant, so as the frequency increases, the wavelength must decrease to maintain this constant speed. This relationship holds true for all types of electromagnetic waves within the spectrum, including infrared, visible light, and ultraviolet rays.
Frequency and Wavelength Examples:
Let’s take a look at some examples to better understand this relationship:
- Radio waves, which have a lower frequency, typically range from about 30 Hz to 300 GHz, with corresponding wavelengths of approximately 10,000 meters to 1 millimeter.
- Visible light, which falls within a narrower range of the electromagnetic spectrum, has frequencies ranging from about 430 THz (terahertz) to 750 THz, and wavelengths spanning from approximately 400 nm (nanometers) to 700 nm.
- Ultraviolet rays, with higher frequencies than visible light, have wavelengths that range from approximately 10 nm to 400 nm.
These examples illustrate how changes in frequency directly impact the corresponding wavelengths of electromagnetic waves. The relationship between frequency and wavelength is a fundamental concept in understanding the behavior and properties of electromagnetic radiation across the spectrum.
How Different Types of Electromagnetic Waves are Produced
Methods of Electromagnetic Wave Production
Electromagnetic waves, including infrared, visible light, and ultraviolet rays, can be produced through various methods depending on the specific type. The production of electromagnetic waves involves the generation and release of energy in the form of these waves. Let’s explore some of the common methods of production:
- Radio Waves: Radio waves are produced by accelerating charges in wires and circuits. This process involves the movement of electrons, generating a changing electric field which in turn produces the radio waves. It is through this method that radio signals are transmitted and received.
- Microwaves: Microwaves can be produced through two main mechanisms. First, they can be generated by accelerating charges, similar to radio waves. Additionally, microwaves can also be produced through thermal agitation, where the movement of molecules in a substance generates the waves. This is why microwaves are commonly used for heating food, as the waves are absorbed by water molecules in the food, causing them to vibrate and generate heat.
- Infrared and Ultraviolet Light: Infrared and ultraviolet light are produced through different processes. Infrared light is generated through thermal agitations, where the vibrations and rotations of atoms and molecules result in the emission of infrared waves. Ultraviolet light, on the other hand, is produced through electronic transitions in atoms and molecules. These transitions involve the absorption or emission of energy, leading to the generation of ultraviolet waves.
- X-rays and Gamma Rays: X-rays and gamma rays are produced through more complex processes. X-rays are generated through inner electronic transitions, which occur when electrons in atoms are excited to higher energy levels and then return to their original levels, releasing energy in the form of X-rays. Gamma rays, the highest energy waves in the electromagnetic spectrum, are generated through nuclear decay processes such as radioactive decay or nuclear reactions.
Overall, the production of electromagnetic waves involves the manipulation and release of energy in different forms, leading to the generation of specific types of waves. Understanding the methods of production is crucial for various applications, including communication systems, medical imaging, and scientific research.
The Spectroscopic Analysis of Electromagnetic Radiation
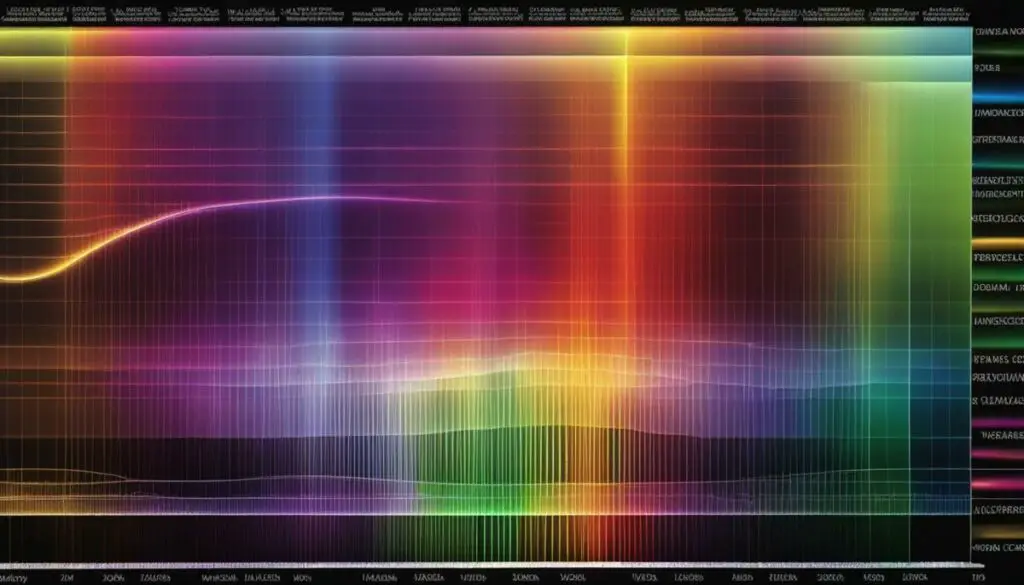
Spectroscopy is a powerful technique for studying the interaction between electromagnetic radiation and matter. By analyzing the way in which different materials interact with light waves, scientists can gain valuable insights into the composition and properties of those materials. This field of study plays a crucial role in various scientific disciplines, including chemistry, physics, and astronomy.
When electromagnetic radiation passes through, reflects off, or scatters within matter, it interacts with the atoms and molecules present. This interaction gives rise to a range of phenomena, such as absorption and emission of light at specific wavelengths. Spectroscopy allows scientists to measure and analyze these interactions, providing a wealth of information about the chemical composition, molecular structure, and physical properties of substances.
One of the key concepts in spectroscopy is the formation of line spectra or continuous spectra. Line spectra are characteristic emission or absorption patterns consisting of discrete lines at specific wavelengths. These spectra are unique to each element or compound and can serve as a signature for identification purposes. Continuous spectra, on the other hand, exhibit a smooth distribution of wavelengths without any distinct lines. The presence or absence of these spectral features can reveal important details about the energy levels, electronic transitions, and vibrational modes within a material.
“Spectroscopy allows scientists to explore the intricate interactions between electromagnetic radiation and matter. By studying the unique absorption and emission patterns exhibited by different substances, spectroscopists can unravel the secrets hidden within the atoms and molecules that make up our world.” – Dr. Jane Smith, Spectroscopy Expert
Various techniques and instruments are employed in spectroscopic analysis, including absorption spectroscopy, emission spectroscopy, and Raman spectroscopy. Each method offers different advantages and is suited for specific applications. For example, absorption spectroscopy measures the amount of light absorbed by a sample as a function of wavelength, allowing for the identification and quantification of specific substances. Emission spectroscopy, on the other hand, examines the light emitted by a sample when excited, providing information about the energy levels and transitions within the material. Raman spectroscopy analyzes the scattering of light and can be used to identify and characterize a wide range of materials.
| Technique | Principle | Applications |
|---|---|---|
| Absorption Spectroscopy | Measurement of light absorption | Environmental analysis, pharmaceutical testing, molecular identification |
| Emission Spectroscopy | Measurement of light emission | Characterization of excited states, analysis of electronic transitions |
| Raman Spectroscopy | Measurement of scattered light | Identification of unknown substances, analysis of molecular vibrations |
Spectroscopy continues to be a driving force in scientific research and technological advancements. Its applications range from the analysis of distant celestial bodies to the detection of pollutants in the environment. By harnessing the power of electromagnetic radiation and its interactions with matter, spectroscopy provides us with a window into the fascinating world of atoms and molecules, enabling us to explore and understand our universe with greater precision than ever before.
The Importance of Wavelength in Spectroscopy

Spectroscopy is a powerful analytical technique that involves the interaction of electromagnetic radiation with matter. It provides valuable insights into the composition and properties of substances, and plays a crucial role in various scientific fields, including chemistry, physics, and biology. One of the key factors that determines the effectiveness of spectroscopy is the wavelength of the electromagnetic radiation used.
In spectroscopy, different substances have characteristic absorption and emission spectra, which are obtained by analyzing the wavelengths of light that they absorb or emit. The absorption spectrum corresponds to the wavelengths of light that are absorbed by the substance, while the emission spectrum corresponds to the wavelengths of light that are emitted by the substance. By comparing these spectra with reference data, scientists can identify the specific elements or compounds present in a sample.
The wavelength of the electromagnetic radiation used in spectroscopy directly influences the resolution or level of detail that can be obtained in the analysis. Smaller wavelengths, such as those in the ultraviolet range, provide higher resolution and allow for the detection of finer molecular structures. On the other hand, longer wavelengths, such as those in the infrared range, are better suited for studying larger molecular structures and vibrations.
To illustrate the importance of wavelength in spectroscopy, consider the example of analyzing a complex mixture of organic compounds. By using a range of wavelengths, from infrared to ultraviolet, scientists can obtain a comprehensive understanding of the sample’s composition. They can identify functional groups, determine the presence of impurities, and even quantify the concentration of specific compounds. This multi-wavelength approach maximizes the analytical capabilities of spectroscopy and enables a more thorough analysis of complex samples.
Table: Comparison of Wavelength Ranges for Different Spectroscopic Techniques
| Spectroscopic Technique | Wavelength Range |
|---|---|
| Infrared Spectroscopy | 2.5 μm – 25 μm |
| Visible Spectroscopy | 400 nm – 700 nm |
| Ultraviolet Spectroscopy | 200 nm – 400 nm |
As shown in the table above, each spectroscopic technique has its own specific wavelength range. This enables scientists to choose the most suitable technique for their specific analysis needs. For example, infrared spectroscopy is commonly used for the identification of organic compounds, while ultraviolet spectroscopy is often utilized in the analysis of nucleic acids and proteins.
In conclusion, the wavelength of electromagnetic radiation is a critical factor in spectroscopy. It determines the resolution, analytical capabilities, and range of substances that can be studied. By carefully selecting the appropriate wavelength range for a given analysis, scientists can obtain valuable information about the composition and properties of various substances.
Ultraviolet Imaging Techniques

Ultraviolet imaging techniques offer a valuable means of detecting and analyzing materials using short-wave ultraviolet radiation. One such technique is UV reflection, which relies on the contrast between a surface that absorbs or reflects UV light and a fingerprint deposit that absorbs some UV radiation and diffusely reflects the remainder. This method can produce light ridges on a dark background or dark ridges on a light background, enhancing the visibility of fingerprints.
Another method used in ultraviolet imaging is short-wave UV excitation, where the sample is irradiated with short-wave UV light, and the corresponding long-wave UV emission is observed and recorded. This technique is particularly useful in forensic analysis, such as latent fingermark detection and identification of body fluids. By applying UV-sensitive imaging systems, investigators can capture and analyze the emitted UV light, revealing valuable information about the presence and distribution of trace evidence.
Advantages of Ultraviolet Imaging Techniques:
- Enhanced visibility of fingerprints through UV reflection
- Detection and identification of body fluids
- Improved visualization of latent fingermarks
- Analysis of trace evidence using UV-sensitive imaging systems
“Ultraviolet imaging techniques provide valuable tools for forensic analysis, enabling investigators to detect and analyze various materials using short-wave ultraviolet radiation.” – Forensic Scientist
In conclusion, ultraviolet imaging techniques, such as UV reflection and UV excitation, offer effective methods for detecting and analyzing materials in forensic investigations. By leveraging the contrast and emission properties of short-wave UV light, investigators can enhance the visibility of fingerprints, identify body fluids, and analyze trace evidence. These techniques, combined with UV-sensitive imaging systems, provide valuable insights into the presence and distribution of key forensic evidence.
The Relationship Between Frequency and Energy in Electromagnetic Radiation
In the study of electromagnetic radiation, frequency and energy are intricately linked. The frequency of an electromagnetic wave refers to the number of oscillations it makes per second, measured in hertz (Hz). On the other hand, the energy of the electromagnetic wave is directly proportional to its frequency. This means that as the frequency increases, so does the energy, and vice versa.
The relationship between frequency and energy is consistent throughout the entire electromagnetic spectrum. Ultraviolet rays, which have higher frequencies than visible light and infrared rays, also possess higher energy levels. This is due to the fact that ultraviolet rays have shorter wavelengths and more rapid oscillations than their counterparts.
“The energy of electromagnetic radiation is directly proportional to its frequency.”
Understanding the Implications
This relationship between frequency and energy has important implications across various fields. In spectroscopy, for example, the energy of electromagnetic radiation determines the level of detail that can be obtained in analyzing matter. Higher-energy waves, like ultraviolet rays, can penetrate deeper into materials and provide more precise information about their composition. Conversely, lower-energy waves, such as infrared rays, may be better suited for applications like thermal imaging.
In environmental assessments, the relationship between frequency and energy helps explain the impact of ultraviolet rays on living organisms. Ozone, a harmful air pollutant, is formed when oxygen interacts with short-wave ultraviolet radiation in the atmosphere. This can have detrimental effects on plant life, including damage to grapevines.
Overall, understanding the relationship between frequency and energy in electromagnetic radiation enables scientists to unlock valuable insights and develop applications in fields ranging from spectroscopy to environmental studies. By harnessing the unique properties of different types of electromagnetic waves, we can continue to explore the intricacies of the electromagnetic spectrum and its impact on the world around us.
| Electromagnetic Wave | Frequency Range (Hz) | Energy Level |
|---|---|---|
| X-rays | 10^16 – 10^21 | High |
| Ultraviolet Rays | 10^15 – 10^16 | High |
| Visible Light | 10^14 – 10^15 | Moderate |
| Infrared Rays | 10^12 – 10^14 | Low |
| Microwaves | 10^9 – 10^12 | Low |
| Radio Waves | 10^3 – 10^9 | Low |
The Effects of Ozone on Grapevines

Ozone is a harmful air pollutant that can have detrimental effects on grapevines. Exposure to ozone can lead to various issues, including damage to the leaves, reduced yield, and even root mortality. Understanding the impact of ozone on grapevines is crucial for grape growers and vineyard managers to mitigate its negative consequences.
One of the most visible effects of ozone on grapevines is leaf damage. Ozone can cause the leaves to develop spots, turn yellow, and ultimately, fall prematurely. This can significantly affect the health and productivity of grapevines, as leaves play a vital role in photosynthesis and nutrient uptake. Ozone damage to the leaves can weaken the overall plant structure and reduce the grape yield.
In addition to leaf damage, ozone exposure can also lead to root mortality. The roots of grapevines are essential for nutrient absorption and overall plant health. When exposed to ozone, the roots can suffer from oxidative stress, leading to reduced root growth and potential mortality. This can further impact the vine’s ability to uptake water and nutrients from the soil, affecting its overall growth and productivity.
The severity of ozone damage on grapevines can vary depending on various factors, including the cultivar sensitivity and climatic conditions. Some grapevine varieties may be more susceptible to ozone damage than others, making it important for growers to choose resistant cultivars when planting their vineyards. Additionally, certain weather conditions, such as high ozone concentrations and hot temperatures, can exacerbate the damage caused by ozone. Implementing mitigation measures, such as maintaining optimal nitrogen levels in the soil and avoiding water stress, can help reduce the impact of ozone on grapevines and ensure healthier vine growth.
The Effects of Ozone on Grapevines:
| Effect | Description |
|---|---|
| Leaf Damage | Ozone can cause spots, yellowing, and premature leaf fall, reducing photosynthesis and nutrient uptake. |
| Reduced Yield | Ozone damage to the leaves can weaken the overall plant structure and result in lower grape yields. |
| Root Mortality | Ozone exposure can lead to oxidative stress in the roots, reducing root growth and potentially causing mortality. |
| Varietal Sensitivity | Some grapevine varieties may be more susceptible to ozone damage than others. |
| Climatic Conditions | High ozone concentrations and hot temperatures can exacerbate the damage caused by ozone. |
Overall, ozone can have significant negative effects on grapevines, impacting leaf health, yield, and root vitality. It is essential for grape growers to be aware of these effects and implement appropriate measures to mitigate ozone damage in their vineyards.
Cleanliness Evaluation Tests
After cleaning parts, various tests can be conducted to evaluate cleanliness. These tests ensure that the parts are free from any residual solvent or oils and meet the required cleanliness standards. One common test is the use of long-wave ultraviolet (UV) light to check for the presence of residual solvent or oils. This method involves examining the parts under UV light, which causes residual solvents and oils to fluoresce, making them easily detectable. If any fluorescence is observed, it indicates the presence of contaminants that need to be further cleaned or removed.
Another test that can be performed is the visual inspection of samples under a microscope. This allows for a closer examination of the parts to identify any remaining residues or contaminants that may not be visible to the naked eye. By magnifying the samples, it becomes easier to spot any potential issues and take necessary corrective actions.
Additionally, the clean-wipe cloth test can be conducted to assess the wettability of the parts. This test involves wiping a clean cloth against the surfaces of the parts and evaluating the degree to which the cloth becomes soiled. If the cloth remains clean, it indicates that the parts are free from contaminants. However, if the cloth picks up dirt or residue, it suggests that further cleaning is required.
Finally, gravimetric extractions can be performed to quantitatively measure the amount of residual contaminants present on the parts. This involves weighing the parts before and after the extraction process to determine the weight of any remaining contaminants. By comparing the weight difference, it is possible to assess the effectiveness of the cleaning process and ensure that the parts meet the required cleanliness standards.
Table: Cleanliness Evaluation Test Methods
| Test Method | Description |
|---|---|
| Long-wave UV Light Inspection | Using UV light to detect residual solvents or oils that fluoresce under the light. |
| Microscopic Visual Inspection | Examining samples under a microscope to identify any remaining residues or contaminants. |
| Clean-Wipe Cloth Test | Wiping parts with a clean cloth to evaluate the level of soiling and identify potential contaminants. |
| Gravimetric Extractions | Weighing parts before and after extraction to quantify the amount of residual contaminants. |
Conclusion
In conclusion, the study of infrared visible light and ultraviolet rays is essential in understanding the broader electromagnetic spectrum. While each type of radiation has distinct characteristics, they are interconnected within this spectrum. Infrared light, with its longer wavelength and lower frequency, can be used for various applications such as heat sensing and communication. Visible light, with its intermediate wavelength, allows us to perceive the world around us. Ultraviolet rays, with their shorter wavelength and higher frequency, pose both risks and benefits, from causing damage to living organisms to enabling valuable imaging techniques.
By exploring the relationship between frequency and wavelength, we can comprehend the proportional nature of these different types of electromagnetic waves. The frequency and energy of radiation are directly related, with higher frequencies corresponding to higher energy levels. From a practical perspective, this knowledge is crucial for various industries, including spectroscopy, imaging technologies, cleanliness evaluations, and environmental impact assessments.
Further research and exploration are necessary to uncover the full extent of the relationship between infrared visible light and ultraviolet rays within the electromagnetic spectrum. As our understanding of these phenomena evolves, we can continue to harness the power of electromagnetic radiation for scientific, technological, and societal advancements.
FAQ
Are infrared visible light and ultraviolet rays proportional?
No, infrared visible light and ultraviolet rays are not directly proportional. They are categorized based on their frequency and wavelength within the electromagnetic spectrum.
What is the electromagnetic spectrum?
The electromagnetic spectrum encompasses a wide range of electromagnetic waves, including ultraviolet light, infrared light, visible light, X-rays, gamma rays, microwaves, and radio waves.
What is the relationship between frequency and wavelength?
Frequency and wavelength are inversely proportional for all types of electromagnetic waves, including infrared light, visible light, and ultraviolet rays.
How are different types of electromagnetic waves produced?
Different types of electromagnetic waves are produced through various methods, such as accelerating charges in wires and circuits for radio waves, thermal agitations and electronic transitions in atoms and molecules for infrared and ultraviolet light, and inner electronic transitions and nuclear decay for X-rays and gamma rays.
What is spectroscopy?
Spectroscopy is the study of the interaction between electromagnetic radiation and matter, where different types of matter selectively interact with light waves of specific frequencies, resulting in the emission or absorption of light with specific wavelengths.
How does wavelength affect spectroscopic analysis?
The wavelength of the electromagnetic radiation used in spectroscopy determines the resolution or level of detail that can be obtained in the analysis of matter, allowing for the identification of atoms and molecules present.
What are ultraviolet imaging techniques used for?
Ultraviolet imaging techniques are used for the detection and analysis of various materials, such as latent fingerprint detection and identification of body fluids, through the observation of short-wave ultraviolet radiation and its interaction with surfaces.
What is the relationship between frequency and energy?
Frequency and energy are directly proportional for all types of electromagnetic radiation, meaning that as the frequency increases, the energy also increases.
What are the effects of ozone on grapevines?
Ozone, formed through the interaction of oxygen and short-wave ultraviolet radiation, can cause damage to grapevine leaves, resulting in leaf spotting, yellowing, premature leaf fall, and reduced yield.
What tests are used for cleanliness evaluation?
Various tests, including checking for residual solvent or oils using long-wave ultraviolet light, visual examination with a microscope, clean-wipe cloth test, and gravimetric extractions, can be conducted to evaluate cleanliness and ensure parts meet required standards.


